Blog Post #3
- vabhisheksambaraj1
- Nov 11, 2023
- 5 min read
For the work period of October 28- November 11, we have determined what components we will be using and which components we will not use for the system. We had first thought to use a chilling device that would cool down the liquid after it had taken the heat load from the solar panel and transferred it to the heat exchanger. However, through our research, we have found that a chiller would require a significant amount of energy to keep it powered on, and that would be counterproductive to our goal of gaining back power lost. A chiller will also not be required as we have decided to use plain water for our liquid rather than a mixture of Ethylene Glycol and chilled water as they would require a chiller and maintenance for the piping/tubing to keep it from freezing or cracking. Our system will consist of a cold plate attached to the back of a solar panel, connected to a radiator which will act as our heat exchanger, a water tank/reservoir to contain the fluid, and a pump to move the fluid throughout the system. All of these components will be connected through tubes or pipes as we are still configuring if the metal pipes will make a difference in the heat transfer that will take place and if it is worth it to pay more for piping rather than tubing. For a design schematic of how this will all be connected look at Figure 1 below.

Figure 1: Physical Sketch of System
Furthermore, determining the end goals and deliverables of power consumption and efficiency gain has been another critical component of our design process that we have finalized. The end goal of our liquid-cooled cold plate system is to gain back efficiency lost by 3% which could also be defined as cooling down the solar panel by 10 degrees Celsius. Our goal is also to have this 3% efficiency gained to be higher than the amount of power that our system will use. We can determine the feasibility of this goal by using the following equations to analyze the performance of the cooling system and the solar panel. We will be calculating the thermal efficiency of the solar panel system under different operating temperatures to determine the performance/the amount of power generated per unit of heat input [1].
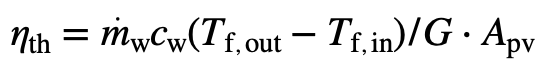
η_th = thermal efficiency
m_w = mass flow rate of water
c_w = specific capacity of water
T_f,out = Temperature of output flow
T_f,in = Temperature of input flow
G = Solar radiation Intensity
A_pv = area of the PV panel
The second equation we will be using is to calculate the electrical efficiency of the solar panel system to determine the ratio of energy available to use from the amount of energy from the source [2].
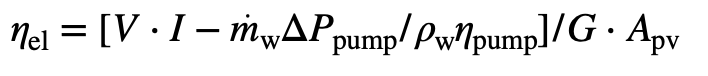
η_el = electrical efficiency
V = output voltage
I = output current
ΔPpump = change in pressure of the pump
ρ_w = water density
η_pump = efficiency of the pump
G = Solar radiation Intensity
A_pv = area of the PV panel
We will use the following equation to determine the relative comparison between the efficiency of the PV panel with and without the liquid-cooled cold plate cooling system [3].
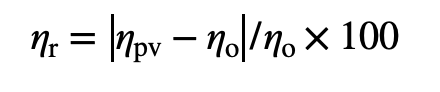
η_r = efficiency comparison
η_pv = efficiency of the PV panel with the cooling system
η_o = efficiency of the PV panel without the cooling system
We can determine the amount of time it takes to cool the solar panel by using a heat balance between the heat gained by water and the heat dissipated from the solar panel shown below.
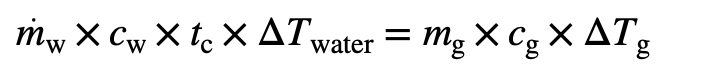
m_w = mass flow rate of water
c_w = specific capacity of water
t_c = cooling time
ΔT_water = change in water temperature
m_g = mass of the aluminum
c_g = heat capacity of aluminum
ΔTg = change in aluminum temperature
Figure 2 below represents the plot for the equation [1] where Mw represents the mass flow rate of the system, Cw represents the specific capacity of water, To and Ti represent the inlet and outlet temperatures, G represents the thermal radiation heat flux, and Apv represents the surface area of the solar panel. For the purposes of our system, the mass flow rate Mw is a variable that can be adjusted to a specified value to change the performance of the system. As can be seen in the figure above, each different flow rate value changed the behavior of the thermal efficiency of the panel. The inlet and outlet temperatures are temperatures from the temperature gradients from the solar panel itself, on a hot day the Delta T will be much larger and therefore provide more efficiency. For the purposes of this project, the radiation heat flux G was set to 1000 W/m^2 as on average the sun emits about 1000W/m^2 per day onto the surface of the earth. This value G can fluctuate depending on where on earth the heat source is measured. As Houston, Texas is somewhat close to the equator, the value in this plot was set to 1000 W/m^2.
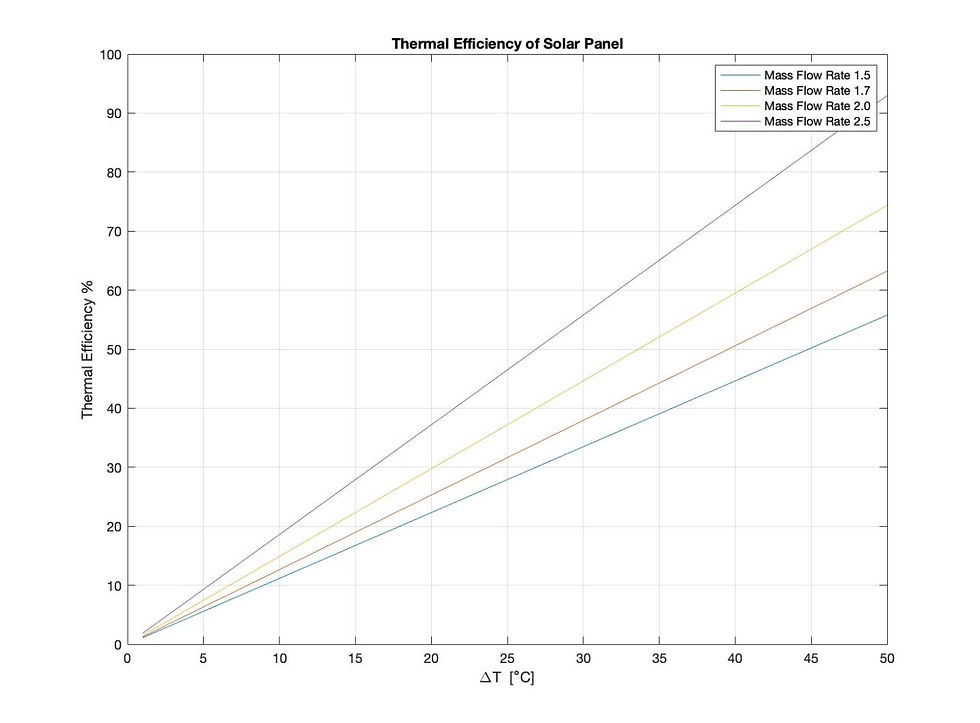
Figure 2: Thermal Efficiency of Solar Panel Plot
The budget of our project has also been finalized based on the components of the system and is listed as follows in Table 1.
Item | Cost | Quantity | Acquired |
Solar Panel | $141.80 | 2 panels | Yes |
Aluminum Sheet/Plate | $100-$200 | 1 | No |
Water Pump | $150 | 1 | No |
Tubing/Piping | $25 | 10 feet | No |
Mount | $30 | 1 | No |
Distilled Water | $7.00 | 3 to 5 gallons | No |
Infrared Thermal Camera | $65.00 | 1 | No |
Heat Exchanger | $100-$150 | 1 | No |
Wire | $25 | 25 feet | No |
Table 1: Budget of Project
Based on Table 1, the total cost of this project is going to be between $643.80 and $793.80.
For the future work going forward there are a few key deliverables that we are going to be completing within the timeline of November 11th to November 25th. Starting with getting more validation & research information from experts in the field such as Dr. Ben Xu & Dr. Dong Liu who have agreed to meet with us in order to provide more depth to our research when it comes to the equations we are utilizing. The next deliverable that is critical is that we CAD all the components of the system such as the cold plate, heat exchanger (radiator with water tank), the solar panel, and the water pump. Once the CAD assembly is done of all the components, Team 26 plans to perform the necessary convection & pump flow analysis of these components using Ansys. Finally, completing the vendor study for the items in the budget will be the last piece in order to complete our Design Phases I & II.
An obstacle that we foresee for the following two weeks would be the learning curve of using the ANSYS software to correctly create a thermal and fluid representation of the team's components to show that each part does, in fact, cool the solar panel effectively. Currently, the team is having trouble getting access to software such as ANSYS and/or COMSOL as those companies require a specific license to use for university students. The team’s solution to this obstacle is to dedicate time each day to learn the basis of the software. The team by no means plans on learning the whole set of tools provided by the software but will plan on learning the tools that will be needed to correctly create a simulation for the type of analysis the team is trying to create. One of the biggest resources Team 26 has and plans on using for this is being able to ask professors such as Dr.Xu and Dr.Liu for help. Also, the team has external online resources the team can index. Another obstacle the team anticipates is the time constraint. Since we are currently a bit behind schedule, there is more pressure to get everything done in time. However, we have a solid plan for the future tasks and are willing to put in the work to get everything done.


Comments